

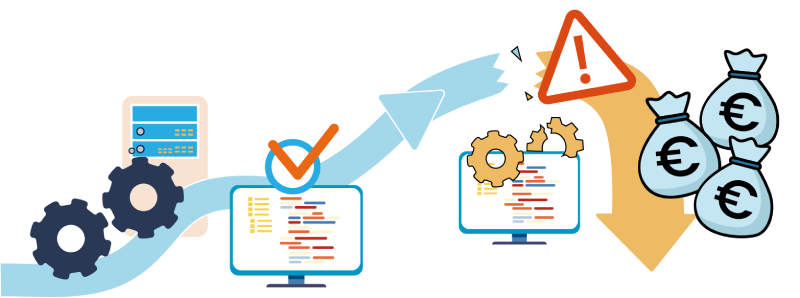
The team responsible for keeping production systems running is often one of the least visible within IT: a hundred developers for just a handful of operations specialists is a common ratio. And there is a reason for that, their job is to make sure nothing happens. A team that performs perfectly generates no incidents, no alerts, and therefore no obvious reason for additional budget.
The cost of underinvestment, however, can materialize all at once: an outage on a Tuesday morning, a contractual penalty, or a missed regulatory deadline. So what does that actually cost?
1. How much does one hour of downtime cost?
Three benchmark studies, three different methodologies, and broadly consistent orders of magnitude.
| Source | Metric | Figure |
|---|---|---|
| Splunk / Oxford Economics 2026 | Average cost | $15,000 per minute, or more than $900,000 per hour |
| Uptime Institute 2026 | Most recent outage experienced | 57 % cost more than $100,000; 1 in 5 exceeded $1 million |
| ITIC 2024 | Companies with 1,000+ employees | 97 % estimate one hour of downtime at more than $100,000 |
| ITIC 2024 | Large enterprises | 41 % estimate the cost at between $1 million and more than $5 million |
Two conclusions stand out. First, the trend: just two years earlier, Splunk estimated the cost at $9,000 per minute. Second, the consistency: ITIC and Splunk survey executives about average estimated costs, while Uptime Institute asks operators about outages they have actually experienced. Despite these different approaches, the figures fall within a similar range. At the other end of the spectrum, only 4% of organizations estimate downtime at less than $100,000 per hour, and 93% of those have fewer than ten employees.
These figures remain averages. An incident during financial closing or at the height of a seasonal peak can send costs soaring. That is why organizations should avoid relying on a generic figure and be wary of widely repeated “cost per minute” statistics that are often based on studies conducted a decade ago.
The per-minute logic, however, remains relevant: the cost of an incident increases in proportion to its duration. At a constant incident frequency, halving recovery time halves the annual cost. This is an engineering lever, not wishful thinking.
2. The hidden costs
The Splunk study estimates the aggregate annual cost at $600 billion, up 50% in two years, or approximately $300 million per company. Direct revenue loss accounts for only $95 million of that amount. The remainder is spread across costs that management accounting rarely consolidates: fines, service penalties, legal expenses, overtime, and crisis communications.
Two figures worth putting directly in front of senior management:
- Share prices fall by an average of 3.4% following a single incident, compared with 2.5% two years earlier.
- 81% of technology executives cite customer loss as one of the consequences of an outage.
And three additional costs may not become visible until the following quarter:
- On-call support. Every poorly controlled deployment window translates into weekends worked, overtime, and increased pressure on teams whose skills are difficult to replace.
- The roadmap. Every day spent rerunning a deployment is a day taken away from projects. It may not appear as an additional expense, but it creates delays.
- Internal trust. After two incidents, business teams start losing confidence in delivery dates, and the organization begins spacing out production releases—which can increase risk rather than reduce it.
3. When the service is running but is no longer compliant
There is another form of disruption that downtime studies do not capture at all.
Some applications must be in production by an externally imposed deadline: a regulatory change, a new rate structure, or changes to social or tax legislation. On that date, the new version must be operational.
In this case, the service has not stopped, it has become non-compliant. The financial and legal consequences can be just as significant, with one aggravating factor: the deadline was known months in advance. Delivering a complete, synchronized application chain by a fixed date is therefore not simply an operational convenience. It is an obligation.
4. The root cause is not technical—it is organizational
This is what turns an unavoidable-looking expense into an investment decision.
- Uptime Institute reports that IT and network-related incidents account for 23% of impactful outages, a growing proportion driven by factors such as architectural complexity, change management, and configuration errors.
- In its 2026 report, 87% of respondents who experienced an outage believed it could have been prevented through better management, processes, or configuration.
- Human error is not classified as a primary cause, but it remains a contributing factor in nine out of ten outages, with failure to follow established procedures identified as the leading driver.
One important distinction is often overlooked: deploying to test and deploying to production are two different disciplines, typically handled by different teams. In the vast majority of organizations, developers do not deploy directly to production. A perfectly optimized Continuous Integration pipeline therefore does not, by itself, protect against the costs described above: it stops where the operational risk begins.
5. The aggravating factor: platform heterogeneity
Applications are no longer deployed on a single technology stack. They span multiple platforms (IBM i, Windows, Linux, containers, public cloud) and interact with neighboring applications that evolve at their own pace.
This has two direct consequences for costs. One major source of deployment failure is deploying an application in isolation without considering the components it depends on. The result is not necessarily a complete outage, but rather a version mismatch: a silent incident that monitoring systems may fail to detect. According to the Splunk study, 47% of executives acknowledge that customers are often the first to detect service degradation. Meanwhile, the cost meter has been running from the moment the issue began.
Rollback also becomes a weak point. Performing a consistent rollback across four platforms managed by four different tools,under pressure, inevitably increases recovery time, which directly multiplies the cost of the incident.
6. The metrics that matter
Operations and development teams do not measure the same things, even when they use similar terminology. Executive management should therefore track both sets of metrics.
| Metric | Origin | Question à laquelle il répond |
|---|---|---|
| MTBF | Operations | How frequently does the risk materialize? |
| MTTR | Operations | How long does each incident last? |
| Change failure rate | Delivery pipeline | How likely is a production deployment to cause a failure? |
| Failed deployment recovery time | Delivery pipeline | How quickly can we return to a stable state? |
As benchmarks, the 2025 DORA report shows that 21.3% of respondents restore service in less than one hour, while 16.7% report a change failure rate between 0% and 4%. For more detail on how these metrics can be managed on a day-to-day basis, our e-book explains the methodology.
Calculate your exposure
Annual cost of risk = (deployments per year × failure rate) × average recovery time × cost per minute
For illustration only, these figures are not industry benchmarks: 240 deployments per year × 10% failure rate × 90 minutes recovery time × €3,000 per minute = approximately €6.5 million per year.
Replace each parameter with your own figures. The exercise produces a defensible amount that can be presented to an investment committee and immediately highlights which lever (frequency, failure rate, or duration) offers the greatest potential impact.
7. Downtime is also a compliance issue
A production incident is no longer purely an internal IT matter: it can become a reportable event.
The transposition of the NIS2 Directive through France's resilience legislation is expected to expand the regulated scope from approximately 500 entities to nearly 15,000 across eighteen sectors, with significant incidents subject to notification within 72 hours. Penalties can reach €10 million or 2% of worldwide annual turnover for essential entities. The financial sector is also subject to the DORA regulation.
The French implementation timeline has undergone several delays, so its current status should be checked. But the direction is clear: outages are becoming traceable, documented, and subject to regulatory scrutiny.
External dependencies are another source of disruption
Across nine years of tracking publicly reported outages, third-party providers (including cloud providers, telecommunications companies, and hosting providers) account for approximately two-thirds of incidents. Outsourcing transfers risk; it does not eliminate it. In fact, it can reduce your control over that risk. Knowing where deployments are executed and which tools are used to manage them is therefore more than a strategic consideration: it is another variable in the risk equation described above.
8. What reduces the cost?
Three levers directly affect the variables in the equation:
- Centralized orchestration reduces the failure rate. One deployment pipeline across all platforms ensures that all components within a release are deployed together or not at all.
- Traceability reduces recovery time. Knowing within minutes what was deployed, where, and by whom removes diagnostic time from the outage. In a 90-minute incident, diagnosis can often account for half of the total duration.
- Controlled rollback reduces both duration and residual risk. A planned, tested, and repeatable rollback process eliminates improvisation under pressure.
The results can be measured: 40% lower deployment costs at System U, 90% less effort required for updates at Seylan Bank, and a direct reduction in weekend on-call work across several organizations.
Conclusion
The cost of a production outage is not something organizations simply have to accept. It is the product of three variables: deployment frequency, failure rate, and recovery time. At least two of these variables depend directly on the tools and processes used to manage production deployments.
That is what makes the issue actionable from an investment perspective. An operations team cannot justify a budget simply by pointing to the absence of incidents. It can justify one by quantifying annual risk exposure and demonstrating, with measurable figures, exactly what can reduce it.

About the author
Marc Dallas
VP R&D, Business Line Manager DROPS & Chief Architect
Marc Dallas is a key figure in technological innovation at ARCAD Software, where he has been working since 1998. After serving as Product Manager and Lead Developer on the client side, he took over as Head of R&D in 2008. As VP of R&D and Chief Architect, he defines the company’s innovation strategy and ensures the architectural consistency of the entire portfolio of solutions, with a resolutely production-oriented approach to operational software. He is also responsible for the direction of DROPS and, since 2025, has been steering the company’s AI strategy.
TRIAL VERSION / DEMO
Request a trial version or a session in our sandbox!

or
